How to use Cash Softwares?
Hello,
In this chapter we are going to see typical Trade Patterns which a trader experiences while trading with our cash software.
For Example, We will take a notional company and its notional prices for the simple understanding of concept.
Company name: - ABC company
Current price of ABC share: - 100
Trader puts current price of 100 in software and software gives Buy Level with it’s targets and sell Level with it’s targets as follows with their respective targets.
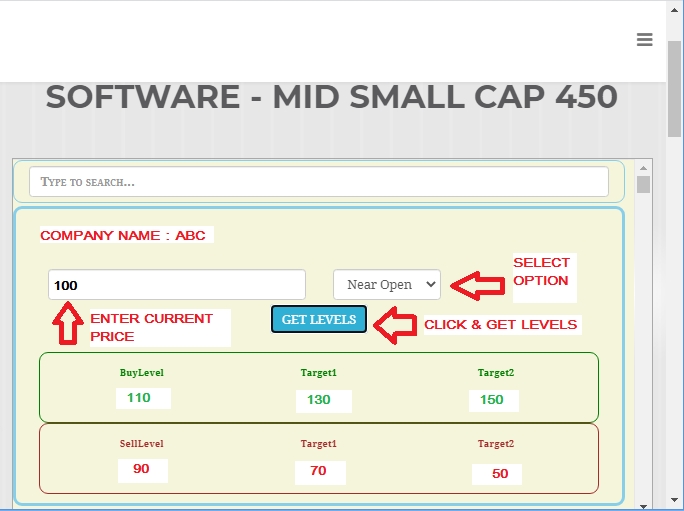
After getting levels from software trader will do trade as per levels crossed by stock price. These trades done by trader will have typical patterns as given below.
BUY TRADE :
In this trade pattern, stock price crosses buy level and hit targets.
Trader waits for buy level to come and buys X amount of shares at buy level and book profit and targets.
For Example, We will take a notional company and its notional prices for the simple understanding of concept.
Company name: - ABC company
Current price of ABC share: - 100
Buy level as per software: - 110
Target level as per software: - 130
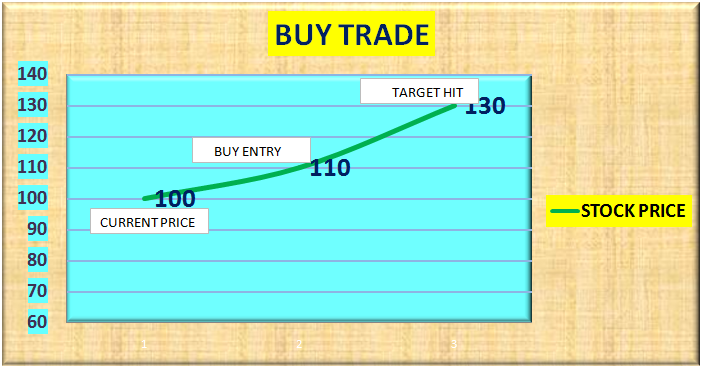
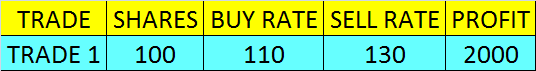
Actual trading happens as given below:-
Stock prices are at 100
Trader waits for break of either Buy or Sell level
After some time, stock prices cross Buy level of 110.
Trader buys 100 shares at 110
Trader holds trade for some time
After some time, stock prices reach 130; Trader sells 100 shares at 130.
Trader books profit at 130
Trader makes profit of Rs.20 on 100 shares
Hence, Trader makes profit of 20*100=2000
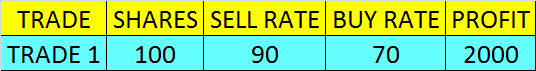
SELL TRADE :
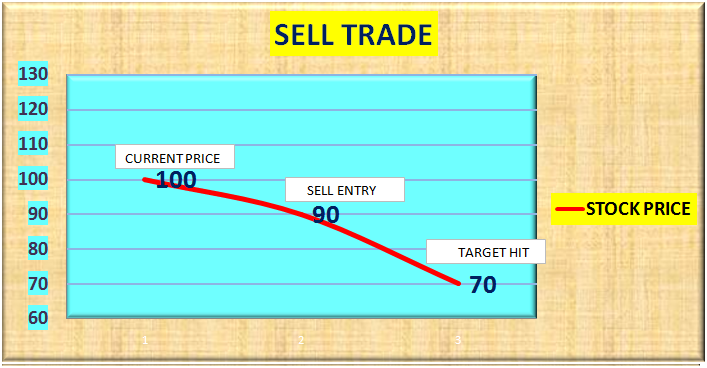
In this trade pattern, stock price crosses sell level and hit targets.
Trader waits for sell level to come and sells X amount of shares at sell level and book profit and targets.
Example, we will take a notional company and its notional prices for the simple understanding of concept.
Company name: - ABC company
Current price of ABC share: - 100
Sell level as per software: - 90
Target level as per software: - 70
Actual trading happens as given below:-
Stock prices are at 100
Trader waits for break of either Buy or Sell level
After some time, stock prices cross Sell level of 90.
Trader sells 100 shares at 90
Trader holds trade for some time
After some time, stock prices reach 70; Trader buys 100 shares at 70
Trader books profit at 70
Trader makes profit of Rs.20 on 100 shares
Hence, Trader makes profit of 20*100=2000
Above trade is called as SHORT SELLING, Short selling is permitted by exchange only in Intra-day trading. Traders cannot do short selling in Positional trading.
INTRA-DAY TRADING – Trader buys and sells on same day. Trader has to close his trade before market closing timing of 3.30pm on the day of trade.
POSITIONAL TRADING - Trader buys and hold stocks in his de-mat account for few days. Trader can close trade as per his wish there is no limit on how long he should hold the trade.
BUY SELL TRADE :
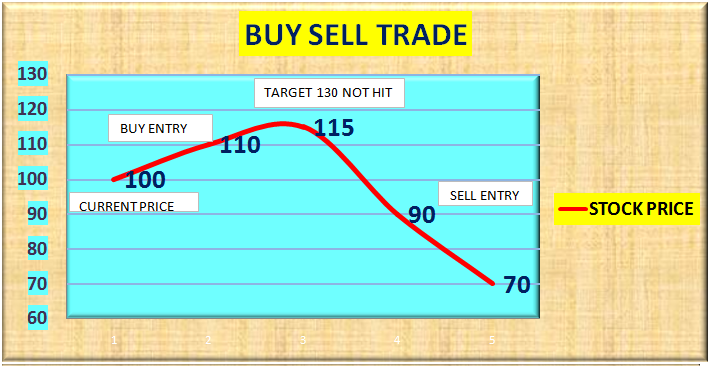
In this trade pattern, stock price crosses buy level and does not hit targets but hit stoploss. And, stock price crosses sell level and hit targets.
Let’s see example,
Company name: - ABC company
Current price of ABC share: - 100
Buy level as per software: - 110
Target level as per software: - 130
Actual trading happens as given below:-
Stock prices are at 100
Trader waits for break of either Buy or Sell level
After some time, stock prices cross Buy level of 110.
Trader buys 100 shares at 110
Trader holds trade for some time
After some time, stock prices reach only around 115 and not hit target of 130; and then fall down up to the sell level of 90.Trader sells 100 shares at 90 and closes his Buy Trade to avoid further losses.
Kindly note here stoploss of buy level is sell level. It means trader will exit Buy Trade if prices fall up to sell level.
Here, Stoploss means the sell level where trader exits his Buy Trade to avoid further losses.
Trader books loss at 90
Trader makes loss of Rs.20 on 100 shares
Hence, Trader makes loss of 20*100=2000
Then,
Trader short sells 200 more shares at 90.
It means trader did short selling of total 300 shares, first 100 to close Buy Trade and another 200 to open new short sell of 200 shares.
Trader holds trade for some time
After some time, stock prices reach 70; Trader buys 200 shares at 70
Trader books profit at 70
Trader makes profit of Rs.20 on 200 shares
Hence, Trader makes profit of 20*200=4000
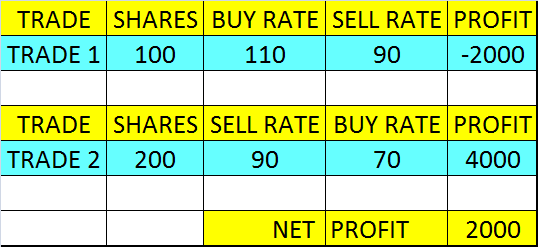
Hence, Traders ledger looks like this.
First trade – buy 100 shares = loss 2000
Second trade – sell 300 shares = profit 4000
Net profit for the day = 2000
SELL BUY TRADE:
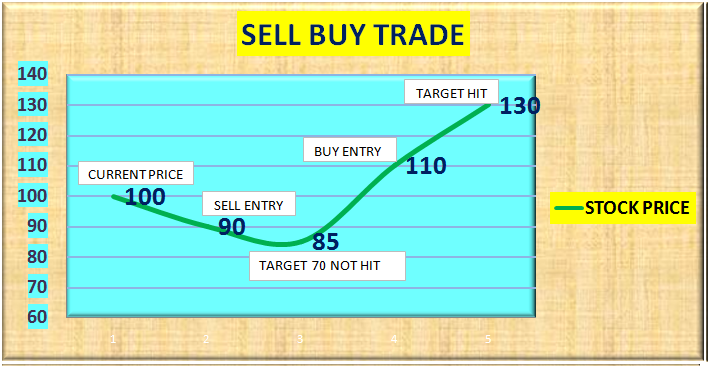
In this trade pattern, stock price crosses sell level and does not hit targets but hit stoploss. And, stock price crosses buy level and hit targets.
Let’s see example,
Company name: - ABC company
Current price of ABC share: - 100
Sell level as per software: - 90
Target level as per software: - 70
Actual trading happens as given below:-
Stock prices are at 100
Trader waits for break of either Buy or Sell level
After some time, stock prices cross sell level of 90.
Trader short sells 100 shares at 90
Trader holds trade for some time
After some time, stock prices reach only around 85 and not hit target of 70; and then rise up to the buy level of 110.Trader buys 100 shares at 110 and closes his Sell Trade to avoid further losses.
Kindly note here stoploss of sell level is buy level. It means trader will exit Sell Trade if prices rise up to Buy level.
Here, Stoploss means the buy level where trader exits his Sell Trade to avoid further losses.
Trader books loss at 110
Trader makes loss of Rs.20 on 100 shares
Hence, Trader makes loss of 20*100=2000
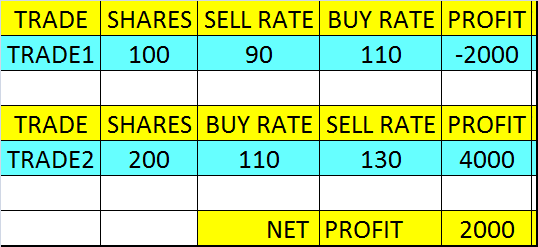
Then,
Trader buys 200 more shares at 110.
It means trader buy total 300 shares, first 100 to close Sell Trade and another 200 to open new buy of 200 shares.
Trader holds trade for some time
After some time, stock prices reach 130; Trader sells 200 shares at 130
Trader books profit at 130
Trader makes profit of Rs.20 on 200 shares
Hence, Trader makes profit of 20*200=4000
Hence, Traders ledger looks like this.
First trade – sell 100 shares = loss 2000
Second trade – buy 300 shares = profit 4000
Net profit for the day = 2000
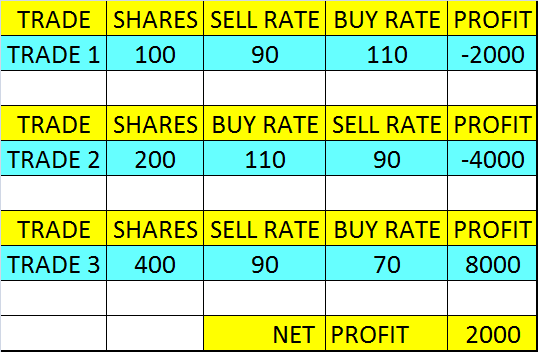
Buy Sell Buy Trade:
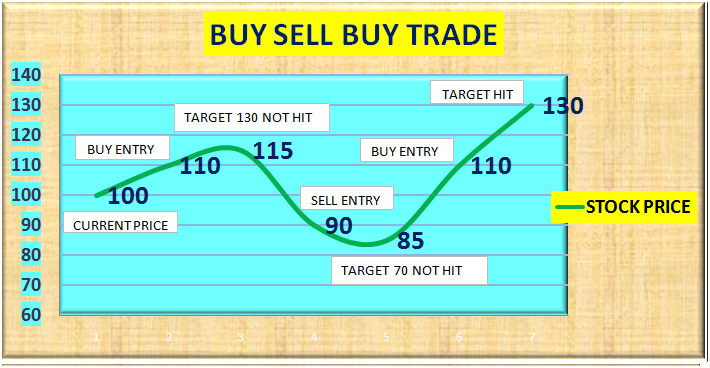
In this trade pattern, stock price crosses buy level and does not hit targets but hit stoploss. And, Stock price crosses sell level and does not hit targets but hit stoploss. Then, stock price crosses buy level and hit targets.
Let’s see example,
Company name: - ABC company
Current price of ABC share: - 100
Buy level as per software: - 110
Target level as per software: - 130
Actual trading happens as given below:-
Stock prices are at 100
Trader waits for break of either Buy or Sell level
After some time, stock prices cross Buy level of 110.
Trader buys 100 shares at 110
Trader holds trade for some time
After some time, stock prices reach only around 115 and not hit target of 130; and then fall down up to the sell level of 90.Trader sells 100 shares at 90 and closes his Buy Trade to avoid further losses.
Kindly note here stoploss of buy level is sell level. It means trader will exit Buy Trade if prices fall up to sell level.
Here, Stoploss means the sell level where trader exits his Buy Trade to avoid further losses.
Trader books loss at 90
Trader makes loss of Rs.20 on 100 shares
Hence, Trader makes loss of 20*100=2000
As stock prices cross sell level of 90.
Trader short sells 200 shares at 90
Trader holds trade for some time
After some time, stock prices reach only around 85 and not hit target of 70; and then rise up to the buy level of 110.Trader buys 200 shares at 110 and closes his Sell Trade to avoid further losses.
Kindly note here stoploss of sell level is buy level. It means trader will exit Sell Trade if prices rise up to buy level.
Here, Stoploss means the buy level where trader exits his Sell Trade to avoid further losses.
Trader books loss at 110
Trader makes loss of Rs.20 on 200 shares
Hence, Trader makes loss of 20*200=4000
Then,
Trader buys 400 more shares at 110.
It means trader buy total 600 shares, first 200 to close Sell Trade and another 400 to open new buy of 400 shares.
Trader holds trade for some time
After some time, stock prices reach 130; Trader sells 400 shares at 130
Trader books profit at 130
Trader makes profit of Rs.20 on 400 shares
Hence, Trader makes profit of 20*400=8000
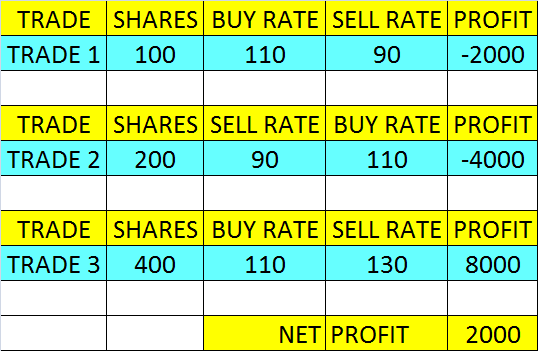
Hence, Traders ledger looks like this.
Sell Buy Sell Trade:
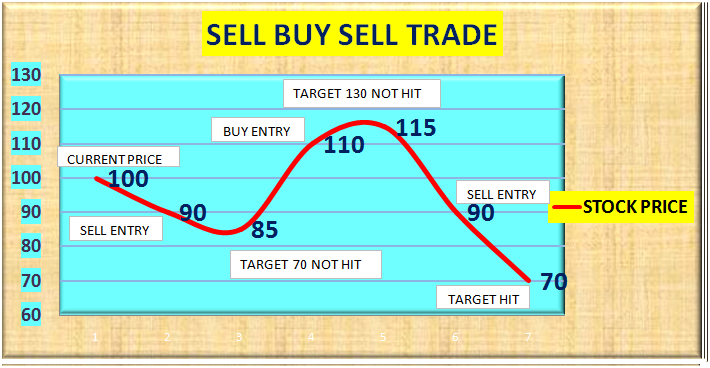
In this trade pattern, stock price crosses sell level and does not hit targets but hit stoploss. And then stock price crosses buy level and does not hit targets but hit stoploss here too. And, stock price crosses sell level and hit targets.
Let’s see example,
Company name: - ABC company
Current price of ABC share: - 100
Sell level as per software: - 90
Target level as per software: - 70
Actual trading happens as given below:-
Stock prices are at 100
Trader waits for break of either Buy or Sell level
After some time, stock prices cross sell level of 90.
Trader short sells 100 shares at 90
Trader holds trade for some time
After some time, stock prices reach only around 85 and not hit target of 70; and then rise up to the buy level of 110.Trader buys 100 shares at 110 and closes his Sell Trade to avoid further losses.
Kindly note here stoploss of sell level is buy level. It means trader will exit Sell Trade if prices rise up to Buy level.
Here, Stoploss means the buy level where trader exits his Sell Trade to avoid further losses.
Trader books loss at 110
Trader makes loss of Rs.20 on 100 shares
Hence, Trader makes loss of 20*100=2000
As, stock prices cross Buy level of 110.
Trader buys 200 shares at 110.
It means trader buys total 300 shares first 100 to close sell position and another 200 to open new buy of 200.
Trader holds trade for some time
After some time, stock prices reach only around 115 and not hit target of 130; and then fall down up to the sell level of 90.Trader sells 200 shares at 90 and closes his Buy Trade to avoid further losses.
Trader books loss at 90
Trader makes loss of Rs.20 on 200 shares
Hence, Trader makes loss of 20*200=4000
Then,
As, stock prices cross Sell level of 90.
Trader short sells 400 more shares at 90.
It means trader did short selling of total 600 shares, first 200 to close Buy Trade and another 400 to open new short sell of 400 shares.
Trader holds trade for some time
After some time, stock prices reach 70; Trader buys 400 shares at 70
Trader books profit at 70
Trader makes profit of Rs.20 on 400 shares
Hence, Trader makes profit of 20*400=8000
Hence, Traders ledger looks like this.